Appearance
Dashboard
The dashboard is the first page after you sign in. It looks different for administrators and for hosting customers.
Administrator view
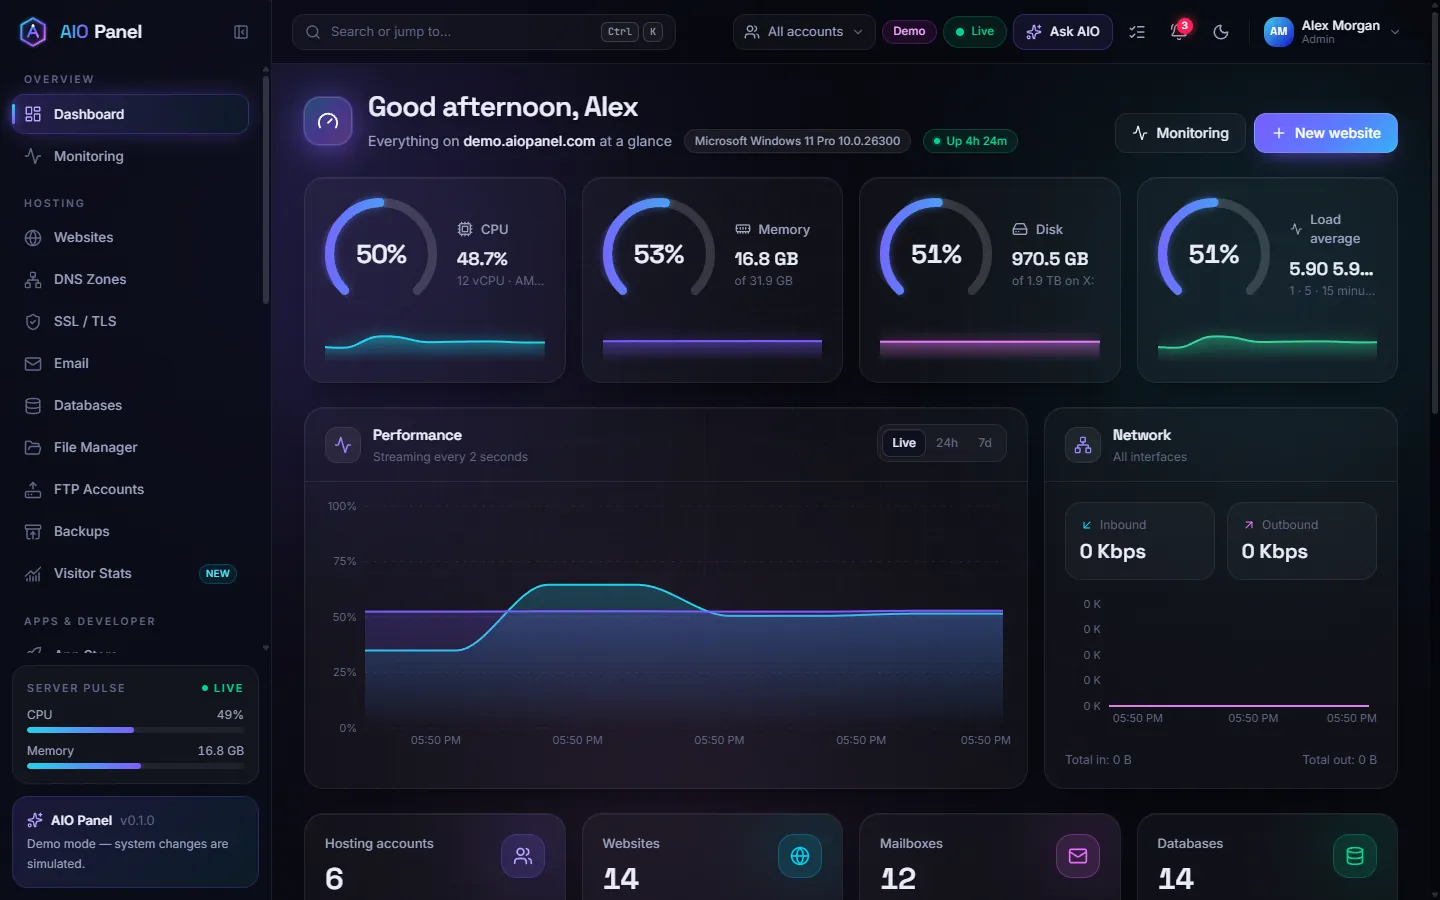
| Area | What it shows |
|---|---|
| Header | Server hostname, operating system and uptime, with Monitoring and New website buttons |
| Gauges | CPU, memory, disk and load average, with a small live sparkline each |
| Performance | A live chart streaming every 2 seconds; switch to 24h or 7d history |
| Network | Inbound and outbound traffic on all interfaces |
| Services | Every managed service (Nginx, Apache, each PHP-FPM version, MariaDB, PostgreSQL, Redis, Postfix, Dovecot...) with a restart button. Manage opens the Services page |
| Quick actions | New website, New account, Email account, Database, Issue SSL, Install app, Backup now, Terminal |
| Recent activity | The latest entries of the audit log; View all opens the Activity Log |
| Counters | Hosting accounts, websites, mailboxes and databases |
How do I restart a service?
Click the restart icon next to it in the Services card. For start, stop, logs and configuration editing, click Manage to open Server → Services.
How do I see older metrics?
Use the 24h and 7d buttons on the Performance card, or open Monitoring for up to 30 days of history, processes and uptime checks (see Monitoring & alerts).
Customer view
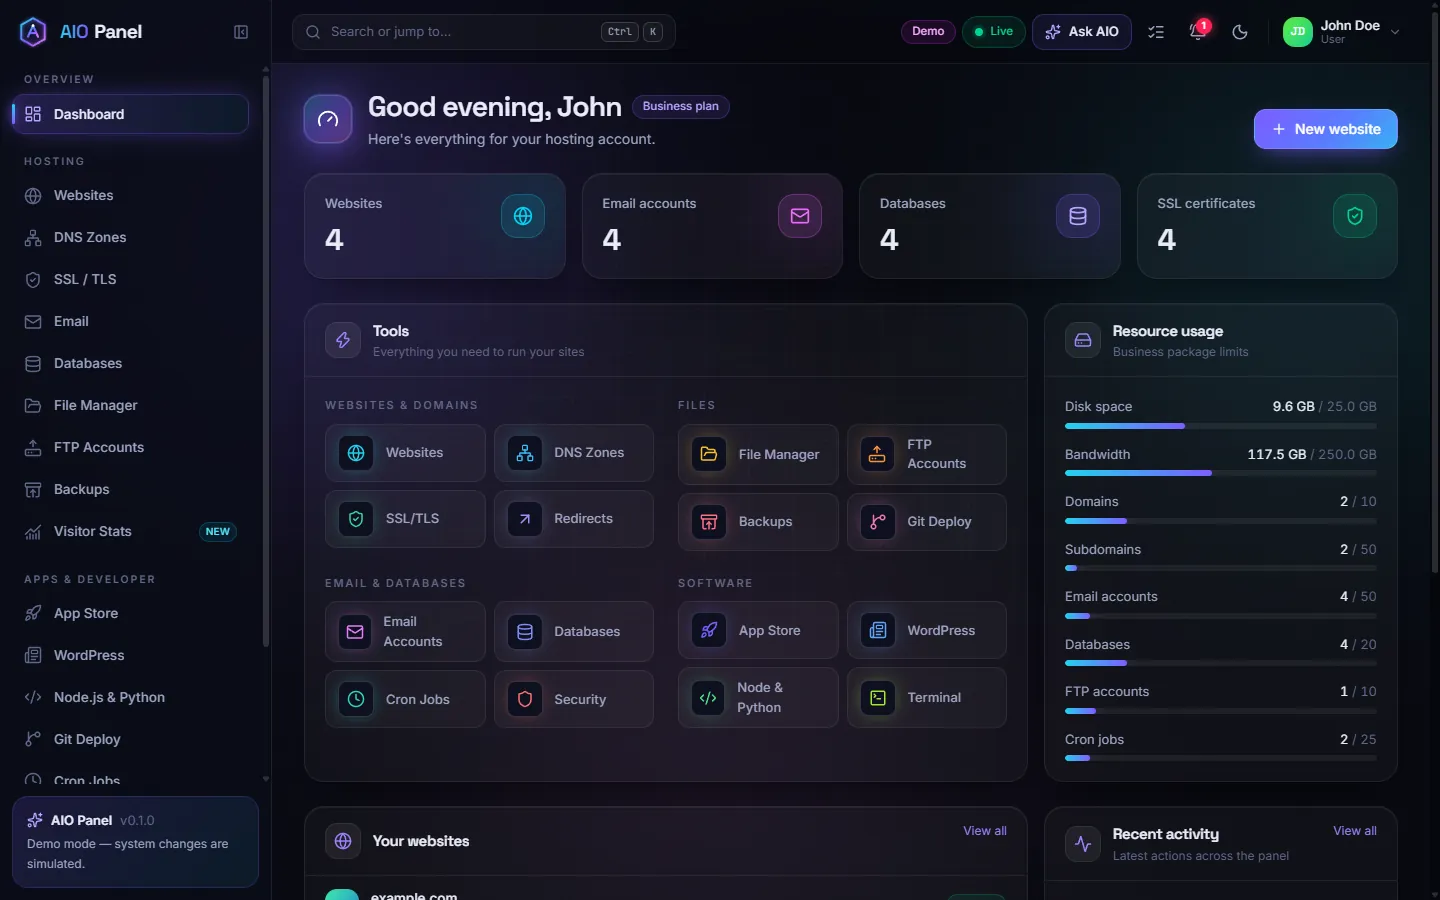
Hosting customers see their own account: the package name, counters for websites, email accounts, databases and SSL certificates, shortcuts to every tool, their Resource usage against the package limits (disk, bandwidth, domains, subdomains, email accounts, databases, FTP accounts, cron jobs), their websites and their recent activity.
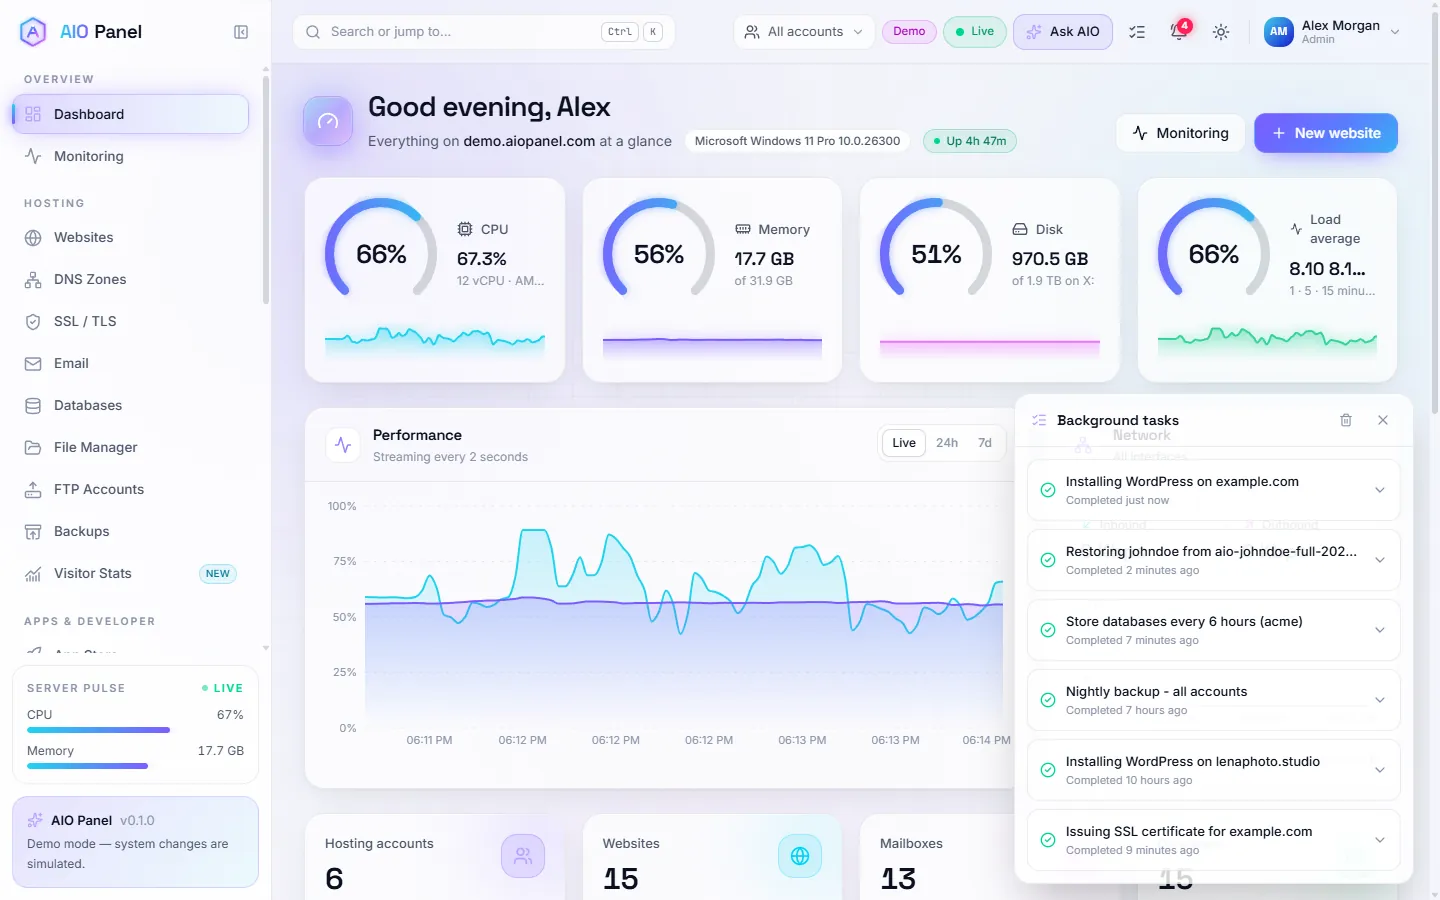
Light theme
Prefer a light interface? Use the Theme button in the top bar (dark, light or system), or Profile → Profile → Appearance.